For this dashboard in tableau desktop, not every single visual look is going to give you a wizard insight into much.
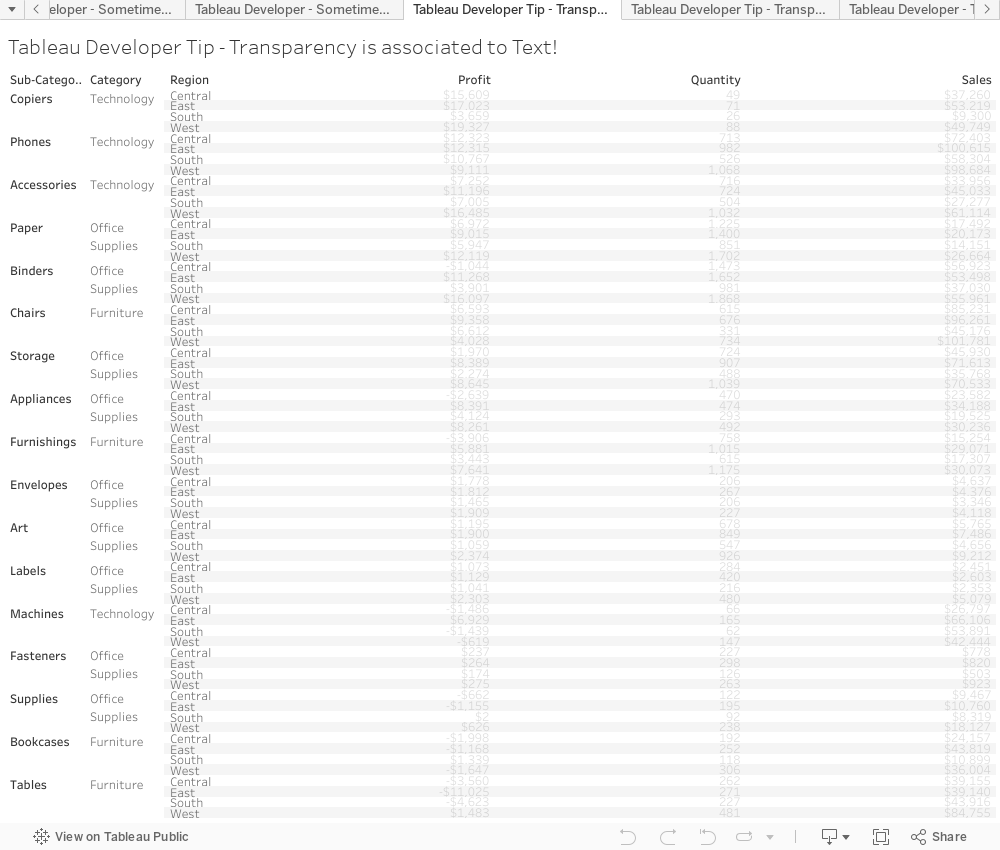
Remember Transparency directly impacts Text, if you are unable to find text, start with your transparency!
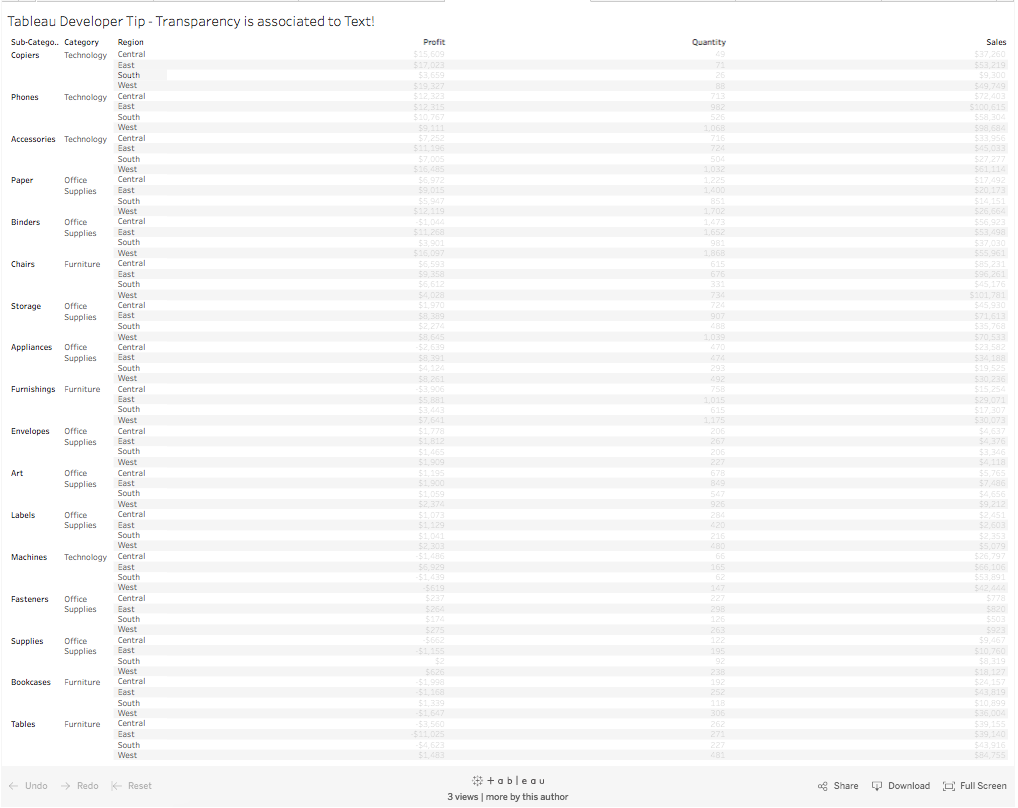
This dashboard shows some clustered information with a gradient of lines you don't need and bad for performance.
Aggregation is key.
Visual Analytic tips by Tableau Developer Tyler of Dev3lop Beta2 by Manufac (hue color test).
Tableau Developer generated: Dim Bars For Subtle Bar Charts in Tableau Desktop.
He said, 'alright Tyler, show everyone.'
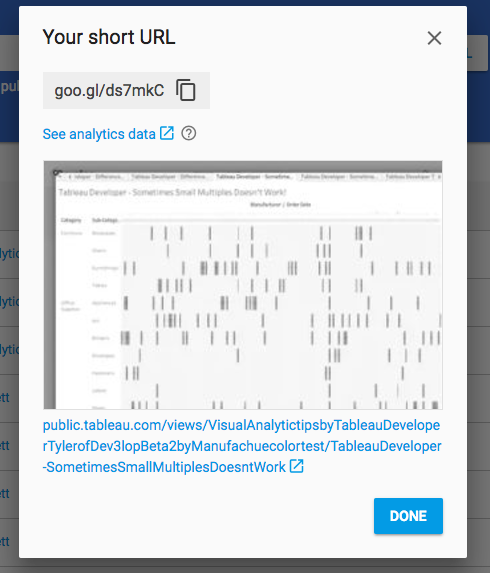
This is a transparent and HUE dashboard. Some pretty basic bars with split by a dimension Manufacturing.
Hello, I'm Tyler, Founder of https://dev3lop.com
Share the short links with them - and we will build a Public Dashboard Together.
This solution will scale for life. It's exciting to see how we will implement it.
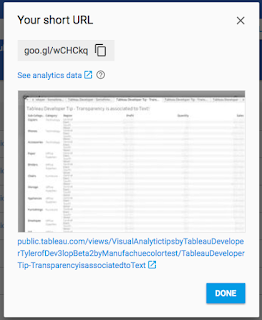
https://public.tableau.com/views/VisualAnalytictipsbyTableauDeveloperTylerofDev3lopBeta2byManufachuecolortest/TableauDeveloper-SometimesSmallMultiplesDoesntWork?:embed=y&:display_count=yes
Global share project: https://goo.gl/wCHCkq
Remember Transparency directly impacts Text, if you are unable to find text, start with your transparency!
This dashboard shows some clustered information with a gradient of lines you don't need and bad for performance.

Aggregation is key.
Visual Analytic tips by Tableau Developer Tyler of Dev3lop Beta2 by Manufac (hue color test).
Tableau Developer generated: Dim Bars For Subtle Bar Charts in Tableau Desktop.
He said, 'alright Tyler, show everyone.'
This is a transparent and HUE dashboard. Some pretty basic bars with split by a dimension Manufacturing.
Hello, I'm Tyler, Founder of https://dev3lop.com
Share the short links with them - and we will build a Public Dashboard Together.
This solution will scale for life. It's exciting to see how we will implement it.
https://public.tableau.com/views/VisualAnalytictipsbyTableauDeveloperTylerofDev3lopBeta2byManufachuecolortest/TableauDeveloper-SometimesSmallMultiplesDoesntWork?:embed=y&:display_count=yes

Data can be used across all aspects of your life.
Share the short link with your mates, paste it into your internal COE, paste it on your website to explain something. Just share the link!
Just use this! It will be cool to show in the future.
- We will track the Google Analytics and paint the world. Cheers!
- Use the dashboard for big screens and a the non-dashboarding for your small screens.
- Paste the short link on your internal business pages.
- Don't worry about repeating yourself or mocking up anything. Just search our website.
Global share project: https://goo.gl/wCHCkq
Please share the link if you use it! We want to see the data grow on Google Analytics.
Please share the link if you use it! We want to see the data grow on Google Analytics.
Comments
Post a Comment