Visual Analytic tips by Tableau Developer Tyler of Dev3lop Beta2 by Manufac (hue color test).
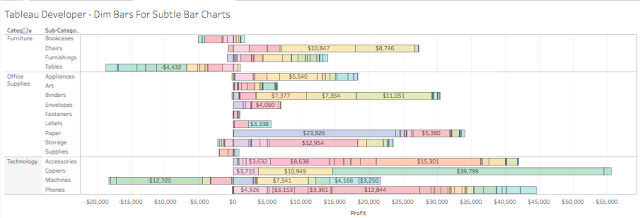
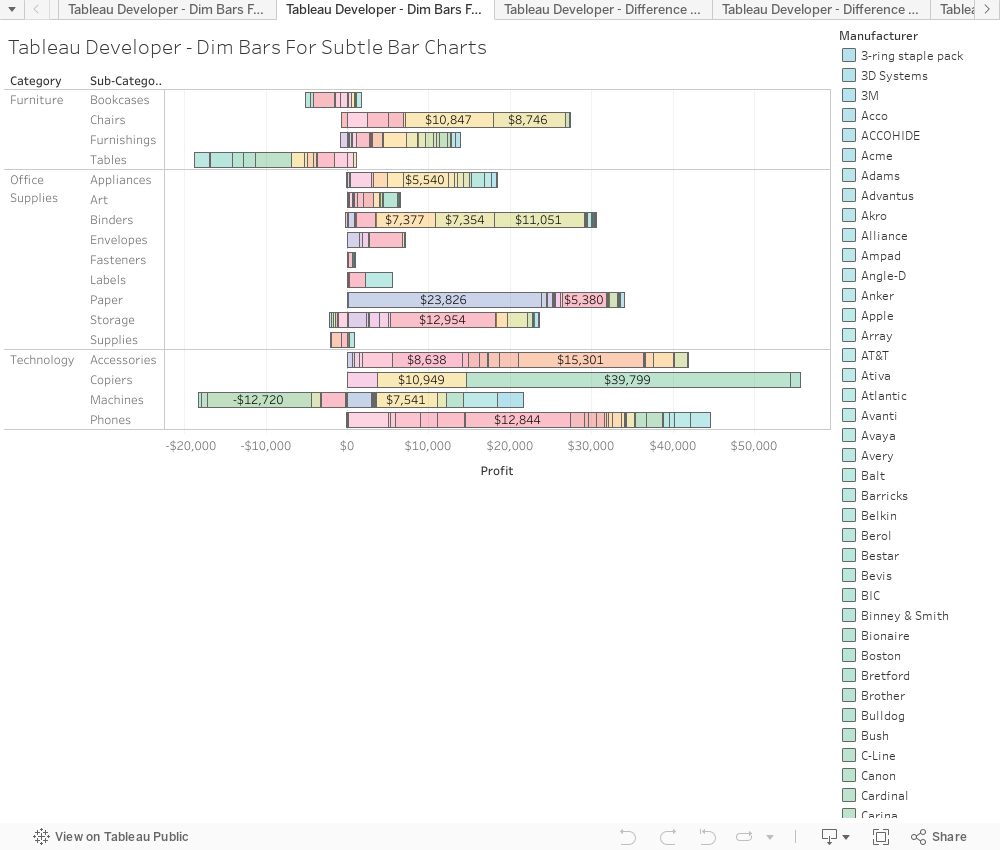
Tableau Developer generated: Dim Bars For Subtle Bar Charts in Tableau Desktop.
Our customer said, 'Orange you tired of repeating yourself.'
Subtle Bar charts anyone? Free Bar chart sample, can't beat that. Change the data to say anything you want.
He said, 'alright Tyler, show everyone.'
This is a transparent and HUE dashboard. Some pretty basic bars with split by a dimension Manufacturing.
Feel free to use this as an example in your internal COE.
Use the short link strategy if you're truly a big data nerd like me.
Hello, I'm Tyler, Founder of https://dev3lop.com
Share the short links with them - and we will build a Public Dashboard Together.
This solution will scale for life. It's exciting to see how we will implement it.
https://public.tableau.com/views/VisualAnalytictipsbyTableauDeveloperTylerofDev3lopBeta2byManufachuecolortest/TableauDeveloper-DimBarsForSubtleBarCharts?:embed=y&:display_count=yes
 Global share project: https://goo.gl/6yuc3k
Tableau Developer generated: Dim Bars For Subtle Bar Charts in Tableau Desktop.
Our customer said, 'Orange you tired of repeating yourself.'
"Why don't you document it like your other stuff?"Good idea.
Subtle Bar charts anyone? Free Bar chart sample, can't beat that. Change the data to say anything you want.

He said, 'alright Tyler, show everyone.'
This is a transparent and HUE dashboard. Some pretty basic bars with split by a dimension Manufacturing.
Feel free to use this as an example in your internal COE.
Use the short link strategy if you're truly a big data nerd like me.
Hello, I'm Tyler, Founder of https://dev3lop.com
Share the short links with them - and we will build a Public Dashboard Together.
This solution will scale for life. It's exciting to see how we will implement it.
https://public.tableau.com/views/VisualAnalytictipsbyTableauDeveloperTylerofDev3lopBeta2byManufachuecolortest/TableauDeveloper-DimBarsForSubtleBarCharts?:embed=y&:display_count=yes
Data can be used across all aspects of your life.
Share the short link with your mates, paste it into your internal COE, paste it on your website to explain something. Just share the link!
Just use this! It will be cool to show in the future.
Learned a lot of new things from your post ,It's amazing article
ReplyDeleteTableau Online Training