Visual Analytic tips by Tableau Developer Tyler of Dev3lop Beta2 by Manufac (hue color test).
Tableau Developer generated: Dim Bars For Subtle Bar Charts in Tableau Desktop.
He said, 'alright Tyler, show everyone.'
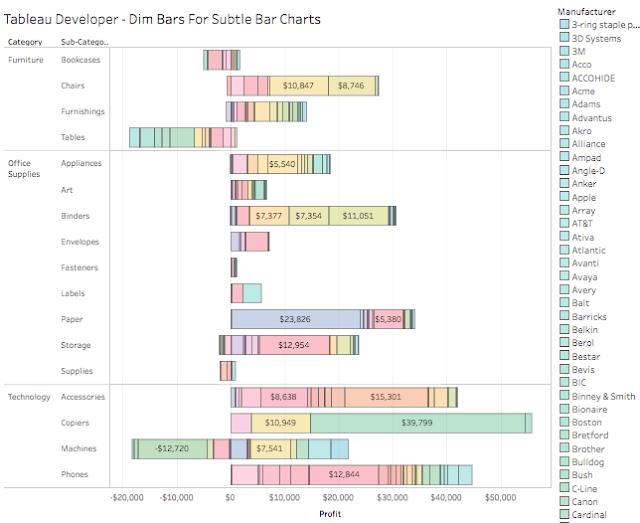
A fun observation and test #1 - these dashboards have extra granularity. And tell a story.
Hello, I'm Tyler, Founder of https://dev3lop.com
Share the short links with them - and we will build a Public Dashboard Together.
This solution will scale for life. It's exciting to see how we will implement it.
 https://public.tableau.com/views/VisualAnalytictipsbyTableauDeveloperTylerofDev3lopBeta2byManufachuecolortest/TableauDeveloper-DimBarsForSubtleBarCharts-Dashboarding?:embed=y&:display_count=yes
Global share project: https://goo.gl/BB2Rxr
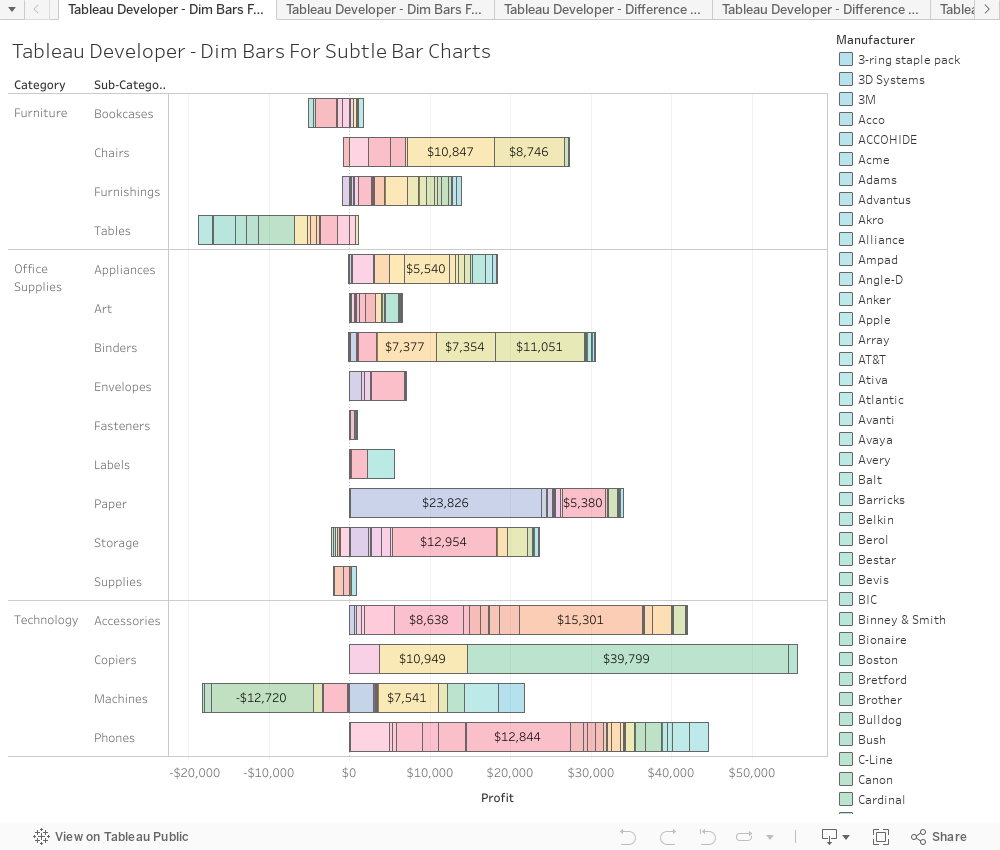
Tableau Developer generated: Dim Bars For Subtle Bar Charts in Tableau Desktop.
My friend told me "Focus on your blade, what are you good at?"I replied 'Tableau.'
He said, 'alright Tyler, show everyone.'

A fun observation and test #1 - these dashboards have extra granularity. And tell a story.
Hello, I'm Tyler, Founder of https://dev3lop.com
Share the short links with them - and we will build a Public Dashboard Together.
This solution will scale for life. It's exciting to see how we will implement it.
https://public.tableau.com/views/VisualAnalytictipsbyTableauDeveloperTylerofDev3lopBeta2byManufachuecolortest/TableauDeveloper-DimBarsForSubtleBarCharts-Dashboarding?:embed=y&:display_count=yesGlobal share project: https://goo.gl/BB2Rxr
Data can be used across all aspects of your life.
Share the short link with your mates, paste it into your internal COE, paste it on your website to explain something. Just share the link!
Just use this! It will be cool to show in the future.
Comments
Post a Comment