Observation and test #1- what are people clicking on?
I'm going to come back and report on all the data too. See you in a few years data project. I hope it goes well.
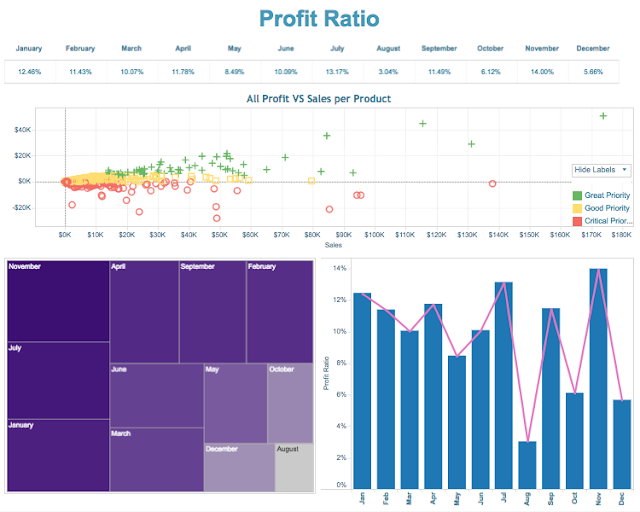
Tableau-Developer-Building-Dashoards-in-Tableau-Desktop 1
Tableau-Developer-Building-Dashoards-in-Tableau-Desktop 2
Tableau-Developer-Building-Dashoards-in-Tableau-Desktop 3
Tableau-Developer-Building-Dashoards-in-Tableau-Desktop 4
Tableau-Developer-Building-Dashoards-in-Tableau-Desktop 6
Tableau-Developer-Building-Dashoards-in-Tableau-Desktop 7
Tableau-Developer-Building-Dashoards-in-Tableau-Desktop 8
We don't need no stinking 9.
Tableau-Developer-Building-Dashoards-in-Tableau-Desktop 10
Tableau-Developer-Building-Dashoards-in-Tableau-Desktop 11
Tableau-Developer-Building-Dashoards-in-Tableau-Desktop 12
Here's my first dashboard - Another test - Below - Maybe these short sheet names are easier to click on. For me I find myself losing the reason for the click if it's not built into the link, and without a numbering system, I'm lost.
Maybe primary keys have generated an extra need in my life. Order, unique qualifiers, row level operations.
Nevermind!
Enjoy.
Sales VS Profit
Q2
Profit Ratio
Profit Monitoring by Age per State
Dashboard 5
DD2
On the fly
DD3
Stacked Bar Chart
Returned
Not Returned
World Map
All Region's Sales VS Profit by Month
All Region's Sales VS Profit by Zip Code
All Region's Sales VS Profit per Product
Profit Ratio Data
Block View
Profit Ratio
Floating Details
All Sales VS Profit per Product
All Profit VS Sales per Product
Profit Pie Chart By Region
Age Median
States/Profit/Sales
I'm going to come back and report on all the data too. See you in a few years data project. I hope it goes well.

- Tableau Developer - Dim Bars For Subtle Bar Charts - Dashboarding
- Tableau Developer - Dim Bars For Subtle Bar Charts
- Tableau Developer - Difference Table Across on Color
- Tableau Developer - Difference Table Across on Color - Dashboarding
- Tableau Developer - Sometimes Small Multiples Doesn't Work!
- Tableau Developer - Sometimes Small Multiples Doesn't Work! - Dashboarding
- Tableau Developer Tip - Transparency is associated to Text!
- Tableau Developer Tip - Transparency is associated to Text! - Dashboarding
- Tableau Developer - Transparency on Cluttered Maps
- Tableau Developer - Transparency on Cluttered Maps - Dashboarding
- Tableau Developer - Transparent Map, Don't use Profit on Size
- Tableau Developer - Transparent Map, Don't use Profit on Size - Dashbaording
- Freelance Tableau Developer - Use Mark Card Bars VS Green Pill on Columns
- Freelance Tableau Developer - Use Mark Card Bars VS Green Pill on Columns - Dashboarding
- Tableau Developer - Give them Database Credentials not data Tables.
- Tableau Developer - Give them Database Credentials not data Tables. - Dashbaording
- Tableau Developer - Percent Difference year over year - keep it simple make text BIG.
- Tableau Developer - Percent Difference year over year - dashboarding
- Tableau Developer - Lolly Pop Charts
- Tableau Developer - Lolly Pop Charts - Dashbaording
- Tableau Developer - Keep Bar Charts Easy on the Eyes
- Tableau Developer - Keep Bar Charts Easy on the Eyes - dashboarding
- Really cool vizy
- Really Cool Vizzy
Which looks the most enticing?
I left misspelled words to drive conversion. Because being different works more than being the same as everyone else. It's working :)
We worked hard to build every dashboard.
We hope you enjoy.
Here's another slew of great tips and walk throughs. With this one, I'm wondering if being cute and adding the joke, will help the chances of someone clicking through!
Driving more help is the goal.
Here's my first dashboard - Another test - Below - Maybe these short sheet names are easier to click on. For me I find myself losing the reason for the click if it's not built into the link, and without a numbering system, I'm lost.
Maybe primary keys have generated an extra need in my life. Order, unique qualifiers, row level operations.
Nevermind!
Enjoy.
Comments
Post a Comment